

TL;DR: AI data center costs should be assessed against facility type, rack density, cooling design, redundancy and available power – not treated as a standard capacity project. The source reports higher per-square-foot costs for AI-optimized facilities, with power infrastructure and cooling representing major construction-cost shares. Its monetary benchmark amounts are obscured, so they should not be used as project estimates without verification.
- AI-optimized facilities are reported as 50% to 100% more expensive per square foot than traditional data centers, partly because of liquid cooling and denser racks.
- Compare cost per MW with cost per square foot: one reflects operational capacity, the other the physical footprint.
- Power infrastructure accounts for a reported 40-45% of construction costs, while cooling accounts for 15-25%.
- Location can shift reported costs by up to 40%, and moving up Uptime Institute tiers can add 15% to 25%.
- The supplied monetary benchmarks are masked; verify the original values before using them in an estimate.
AI capacity is not a routine building expansion. AI-optimized facilities carry higher construction intensity than standard facilities, and their power and cooling requirements change the project’s cost profile before the first rack is installed. AI data center costs need a separate approval gate: compare the facility design, available electricity and intended workload before treating more compute as a straightforward capacity increase.
AI data center costs should be assessed against facility type, rack density, cooling design, redundancy and available power – not treated as a standard capacity project. The source reports higher per-square-foot costs for AI-optimized facilities, with power infrastructure and cooling representing major construction-cost shares. Its monetary benchmark amounts are obscured, so they should not be used as project estimates without verification.
The source benchmarks describe costs by both facility type and physical area, but their monetary amounts are obscured in the supplied material. The comparisons below preserve the reported relationships and technical details without presenting unavailable or exact price figures. That limitation matters: a benchmark can frame a decision, but it cannot replace a project-specific estimate.
What do AI data center costs look like by facility type?
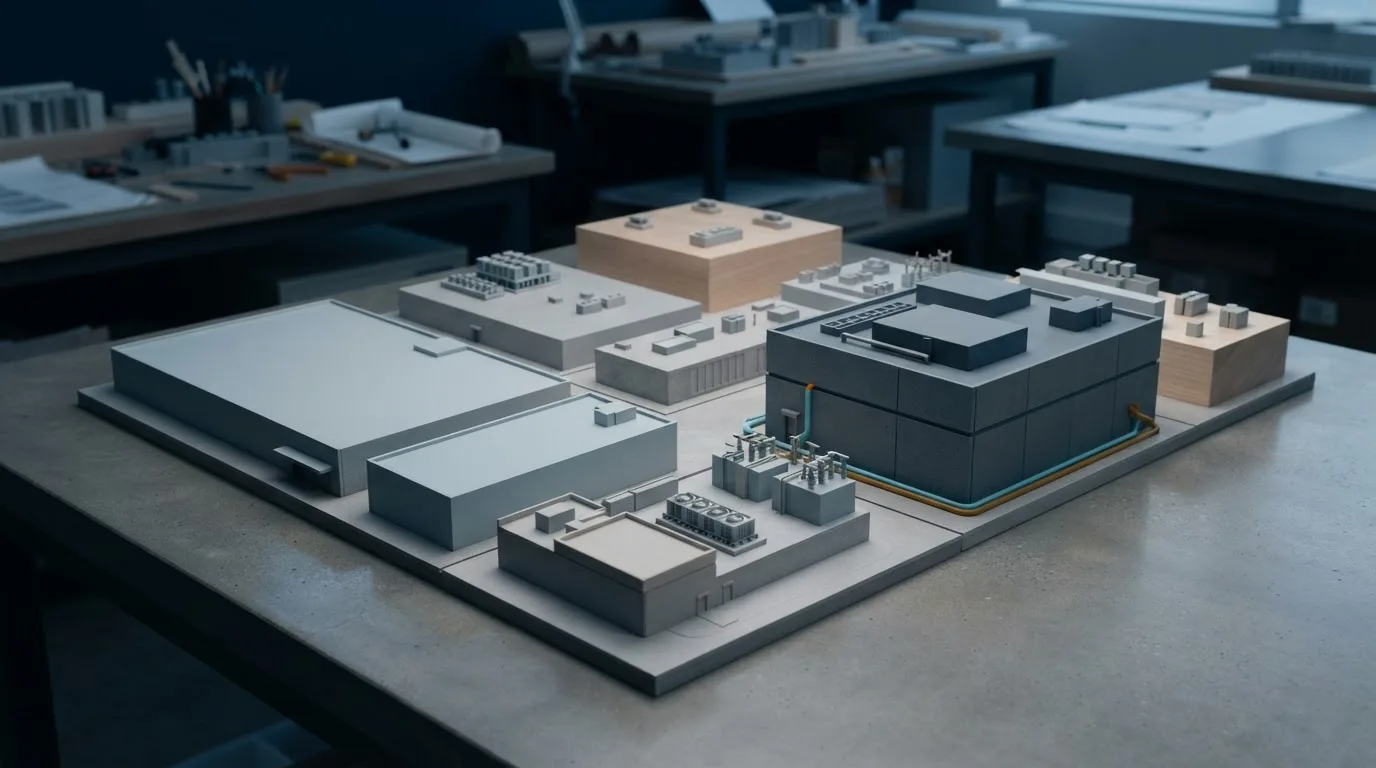
The source distinguishes four facility categories – Enterprise / Tier II, Colocation / Tier III, Hyperscale / Tier IV and AI-Optimized – and compares construction cost per square foot with cost per megawatt. Its reported per-megawatt ranges place AI-optimized facilities above standard facilities, but the specific amounts in the table are masked. Treat that comparison as directional, not as a usable monetary estimate.
 AI GENERATED
The benchmarks cover core construction, including electrical and mechanical systems, structural components and fit-out. They exclude land, IT equipment and permitting. The source also describes regional variation of up to 40%, so a national benchmark may not reflect the labor market or project conditions where you plan to build.
The clearest stated design comparison is per square foot: AI-optimized facilities are reported as 50% to 100% more expensive than traditional data centers. The source attributes that premium partly to advanced liquid cooling and higher rack densities. Those differences make a standard-facility benchmark a weak proxy for an AI build.
How do rack density, cooling and redundancy change the estimate?
AI rack densities in the source range from 30-50+ kW per rack, compared with 5-10 kW in conventional builds. Higher density raises the demands on cooling and electrical systems; liquid cooling is one of the advanced approaches the source identifies. You cannot evaluate the AI premium by looking at floor area alone.
Why do per-MW and per-square-foot costs tell different stories?
Cost per megawatt relates spending to operational capacity; cost per square foot relates it to the building footprint. Both matter because two facilities with the same floor area can support different power loads – and therefore have materially different construction requirements. Comparing just one measure can mislead.
A higher result per square foot than a tier benchmark might reflect a higher-density design or a smaller floor plan, as the source notes. Changing the footprint or the MW target changes that ratio. The practical question is not which measure is “right”; it is whether both describe the same design assumptions.
How should you read construction benchmarks before approving capacity?
Benchmarks are median outcomes, not ideal scenarios. The source says lower-end results are more likely in areas with favorable labor markets, owner-furnished equipment strategies – where an owner buys items such as switchgear and generators directly – or modular design. First-time builders and projects in constrained markets may fall in the mid-to-upper range instead.
Construction cost per MW is also shaped by facility type, location, redundancy and cooling design. The supplied source gives no complete, unmasked monetary schedule, so its figures cannot support a reliable project estimate here. Restore and verify the original benchmark amounts before using them in a capital approval model.
One explicit budgeting trap is upgrading redundancy mid-project without accounting for the Tier premium. The source also reports that standard shell-and-core facilities have a lower average cost per MW than AI campuses, but the monetary values are obscured; do not fill that gap by applying an unrelated facility benchmark. Keep scope and assumptions visible when comparing estimates.
Why should power and workload value be part of the cost gate?
Before approving expansion, compare the proposed workload with the construction intensity it requires, the cooling design, and the electricity available to support the facility. The supplied benchmarks do not determine whether a specific workload justifies a specific build. They do show why an AI capacity request should not pass through the same cost gate as a conventional capacity addition.
 AI GENERATED
Frequently Asked Questions
What makes AI data center construction more expensive than a conventional build?
What should owners compare before approving an AI facility expansion?
Compare the facility type and construction scope, target IT load, planned floor area, rack density, cooling requirements, redundancy tier and power readiness. Per-MW and per-square-foot measures answer different questions, so use both with consistent assumptions. Then assess the intended workload against the capacity being proposed; the source does not provide a universal workload-value threshold.
Key takeaways
- AI-optimized facilities are reported as 50% to 100% more expensive per square foot than traditional data centers, partly because of liquid cooling and denser racks.
- Compare cost per MW with cost per square foot: one reflects operational capacity, the other the physical footprint.
- Power infrastructure accounts for a reported 40-45% of construction costs, while cooling accounts for 15-25%.
- Location can shift reported costs by up to 40%, and moving up Uptime Institute tiers can add 15% to 25%.
- The supplied monetary benchmarks are masked; verify the original values before using them in an estimate.
Practical tips
- Keep target IT load and gross floor area side by side in early comparisons so a density-driven cost difference is not mistaken for a pricing anomaly.
- Set cooling and redundancy assumptions before comparing bids; changing either later can alter the construction scope.
- The source advises starting procurement 18-22 months ahead, considering modular designs and using experienced teams for MEP systems and commissioning.
Related Posts

AI Phishing Scams Need a Customer-Trust Control Plan
A report says AI answers have directed users toward fake company contact…


Accessibility Legal Risk Is a Portfolio Priority
Accessibility legal risk varies by market, authority, and service. Use that…
Microsoft 365 Copilot Chat Renewal: What the 43% Report Means
A reported 43% maximum increase does not apply uniformly. Use usage, avoided…